Se content in liver
Tags: Physiology · Liver
Project: vulpe_liver_2014
1 locus · 16 genes with independent associations · 118 total associated genes
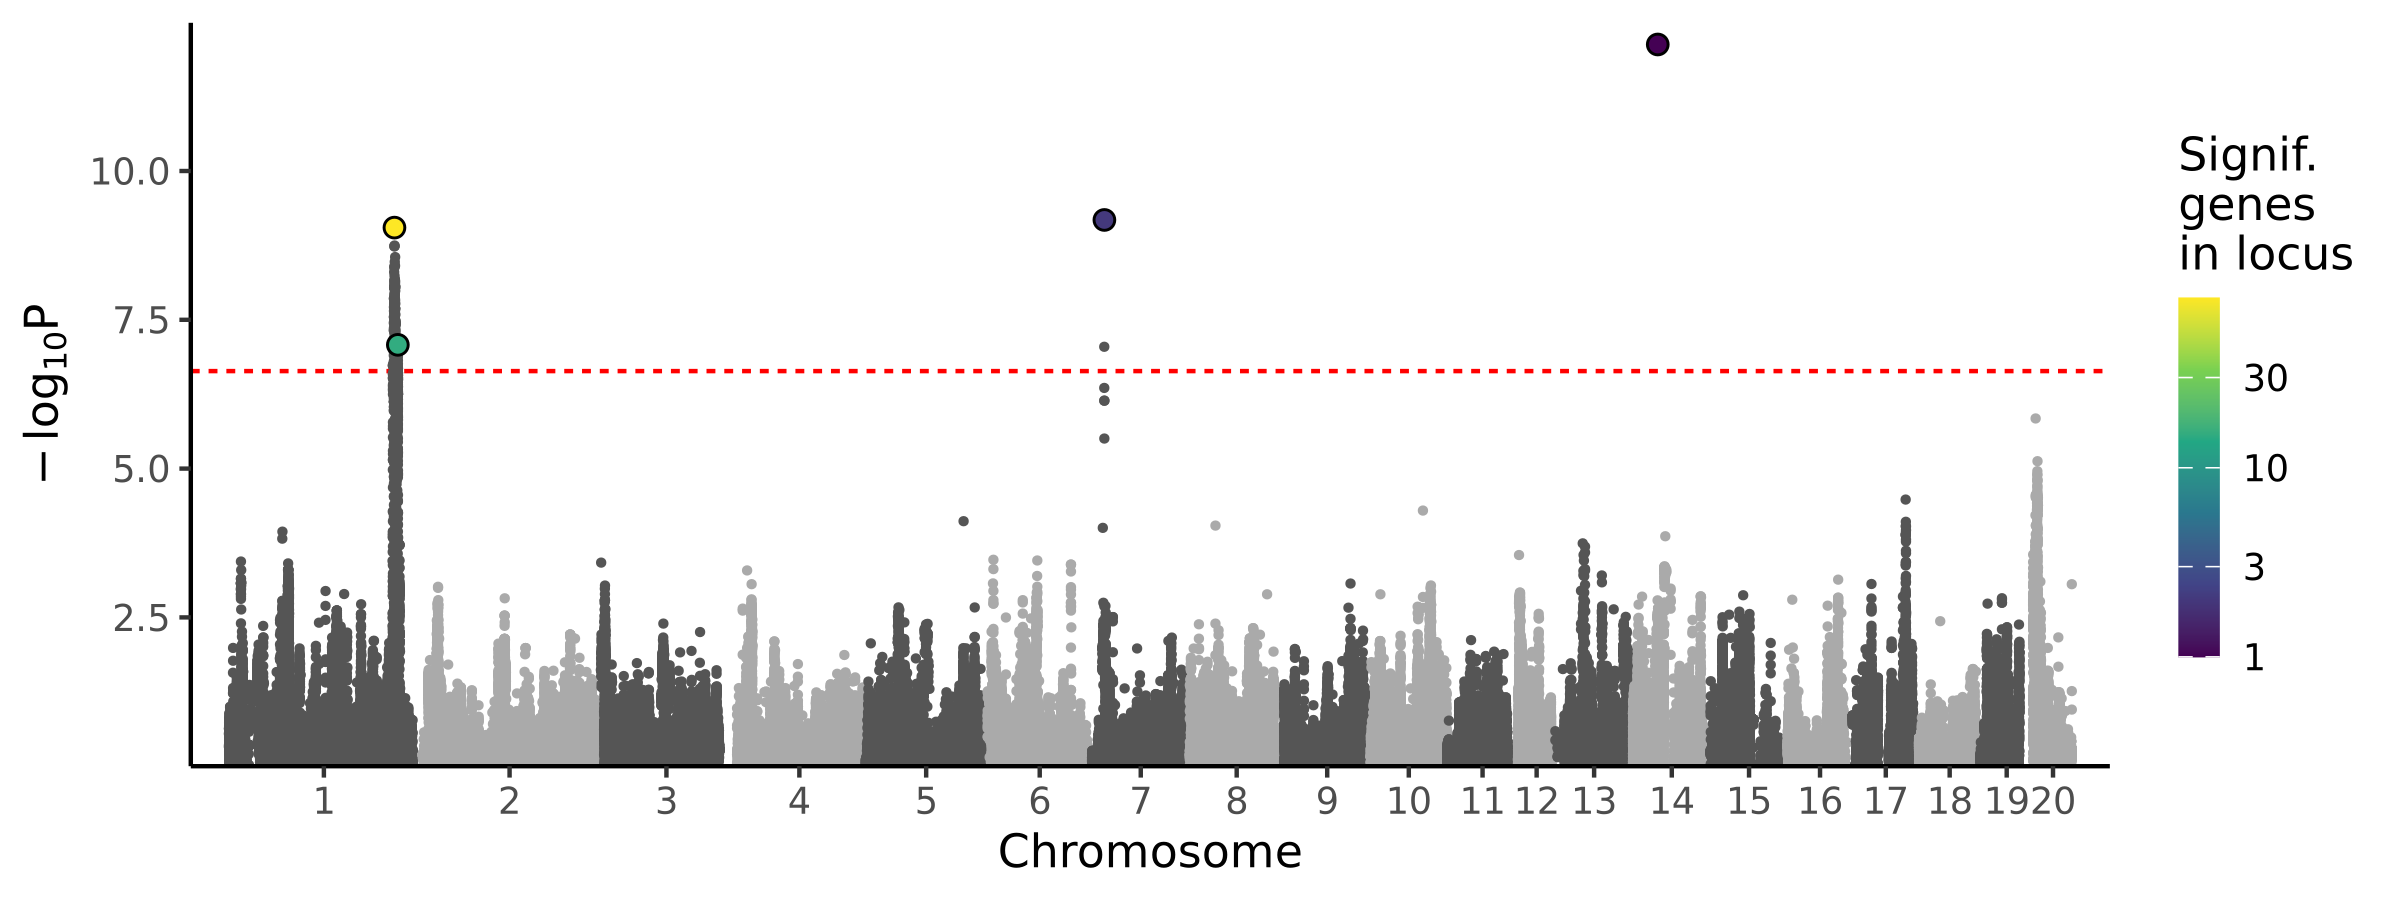
Significant Loci
| # | Chr | Start pos | End pos | # assoc genes | # joint models | Best TWAS P | Best GWAS P | Cond GWAS P | Joint genes |
|---|---|---|---|---|---|---|---|---|---|
| 1 | chr1 | 241196633 | 250121656 | 118 | 16 | 5.34e-11 | 1.95e-09 | 1e+00 | Cyp26a1 Cyp26c1 Cyp2c7l1 Entpd1 Exoc6 Fra10ac1 Hells LOC120100025 LOC134483989 Marchf5 Pank1 Rbp4 Rpp30 Slc35g1 Sorbs1 |
Pleiotropic Associations
Associations by panel
| Tissue | RNA modality | # hits | % hits/tests | Avg chisq |
|---|---|---|---|---|
| Adipose | alternative polyA | 4 | 0.1 | 1.27 |
| Adipose | alternative TSS | 2 | 0.1 | 1.19 |
| Adipose | gene expression | 7 | 0.1 | 1.18 |
| Adipose | isoform ratio | 6 | 0.1 | 1.18 |
| Adipose | intron excision ratio | 5 | 0.2 | 1.37 |
| Adipose | mRNA stability | 5 | 0.1 | 1.21 |
| BLA | alternative polyA | 3 | 0.1 | 1.27 |
| BLA | alternative TSS | 1 | 0.1 | 1.12 |
| BLA | gene expression | 6 | 0.1 | 1.19 |
| BLA | isoform ratio | 2 | 0.1 | 1.18 |
| BLA | intron excision ratio | 0 | 0 | 1.23 |
| BLA | mRNA stability | 0 | 0 | 1.12 |
| Brain | alternative polyA | 2 | 0.1 | 1.19 |
| Brain | alternative TSS | 7 | 0.2 | 1.2 |
| Brain | gene expression | 13 | 0.1 | 1.21 |
| Brain | isoform ratio | 4 | 0.1 | 1.18 |
| Brain | intron excision ratio | 4 | 0.1 | 1.24 |
| Brain | mRNA stability | 5 | 0.1 | 1.13 |
| Eye | alternative polyA | 0 | 0 | 1.39 |
| Eye | alternative TSS | 0 | 0 | 1.16 |
| Eye | gene expression | 0 | 0 | 1.25 |
| Eye | isoform ratio | 0 | 0 | 1.08 |
| Eye | intron excision ratio | 0 | 0 | 1.25 |
| Eye | mRNA stability | 0 | 0 | 1.33 |
| IC | alternative polyA | 4 | 0.2 | 1.34 |
| IC | alternative TSS | 0 | 0 | 1.11 |
| IC | gene expression | 8 | 0.1 | 1.21 |
| IC | isoform ratio | 3 | 0.1 | 1.2 |
| IC | intron excision ratio | 0 | 0 | 1.15 |
| IC | mRNA stability | 2 | 0.1 | 1.15 |
| IL | alternative polyA | 2 | 0.2 | 1.38 |
| IL | alternative TSS | 0 | 0 | 1.16 |
| IL | gene expression | 5 | 0.1 | 1.18 |
| IL | isoform ratio | 3 | 0.2 | 1.22 |
| IL | intron excision ratio | 1 | 0.1 | 1.15 |
| IL | mRNA stability | 0 | 0 | 1.12 |
| LHb | alternative polyA | 2 | 0.2 | 1.16 |
| LHb | alternative TSS | 2 | 0.3 | 1.19 |
| LHb | gene expression | 6 | 0.2 | 1.22 |
| LHb | isoform ratio | 3 | 0.2 | 1.24 |
| LHb | intron excision ratio | 0 | 0 | 1.29 |
| LHb | mRNA stability | 0 | 0 | 1.16 |
| Liver | alternative polyA | 8 | 0.3 | 1.32 |
| Liver | alternative TSS | 5 | 0.2 | 1.27 |
| Liver | gene expression | 8 | 0.1 | 1.22 |
| Liver | isoform ratio | 8 | 0.2 | 1.22 |
| Liver | intron excision ratio | 4 | 0.1 | 1.35 |
| Liver | mRNA stability | 6 | 0.2 | 1.21 |
| NAcc | alternative polyA | 6 | 0.2 | 1.24 |
| NAcc | alternative TSS | 4 | 0.1 | 1.17 |
| NAcc | gene expression | 13 | 0.1 | 1.17 |
| NAcc | isoform ratio | 6 | 0.1 | 1.14 |
| NAcc | intron excision ratio | 9 | 0.1 | 1.19 |
| NAcc | mRNA stability | 4 | 0.1 | 1.17 |
| OFC | alternative polyA | 2 | 0.2 | 1.31 |
| OFC | alternative TSS | 0 | 0 | 1.15 |
| OFC | gene expression | 6 | 0.1 | 1.17 |
| OFC | isoform ratio | 2 | 0.1 | 1.18 |
| OFC | intron excision ratio | 0 | 0 | 1.22 |
| OFC | mRNA stability | 1 | 0.1 | 1.15 |
| PL | alternative polyA | 6 | 0.2 | 1.26 |
| PL | alternative TSS | 5 | 0.2 | 1.17 |
| PL | gene expression | 11 | 0.1 | 1.19 |
| PL | isoform ratio | 4 | 0.1 | 1.14 |
| PL | intron excision ratio | 4 | 0.1 | 1.16 |
| PL | mRNA stability | 3 | 0.1 | 1.16 |
| pVTA | alternative polyA | 2 | 0.1 | 1.27 |
| pVTA | alternative TSS | 4 | 0.2 | 1.18 |
| pVTA | gene expression | 7 | 0.1 | 1.19 |
| pVTA | isoform ratio | 4 | 0.1 | 1.14 |
| pVTA | intron excision ratio | 2 | 0 | 1.17 |
| pVTA | mRNA stability | 1 | 0 | 1.15 |
| RMTg | alternative polyA | 0 | 0 | 1.11 |
| RMTg | alternative TSS | 0 | 0 | 1.15 |
| RMTg | gene expression | 2 | 0.1 | 1.16 |
| RMTg | isoform ratio | 0 | 0 | 1.11 |
| RMTg | intron excision ratio | 0 | 0 | 1.36 |
| RMTg | mRNA stability | 1 | 0.2 | 1.24 |