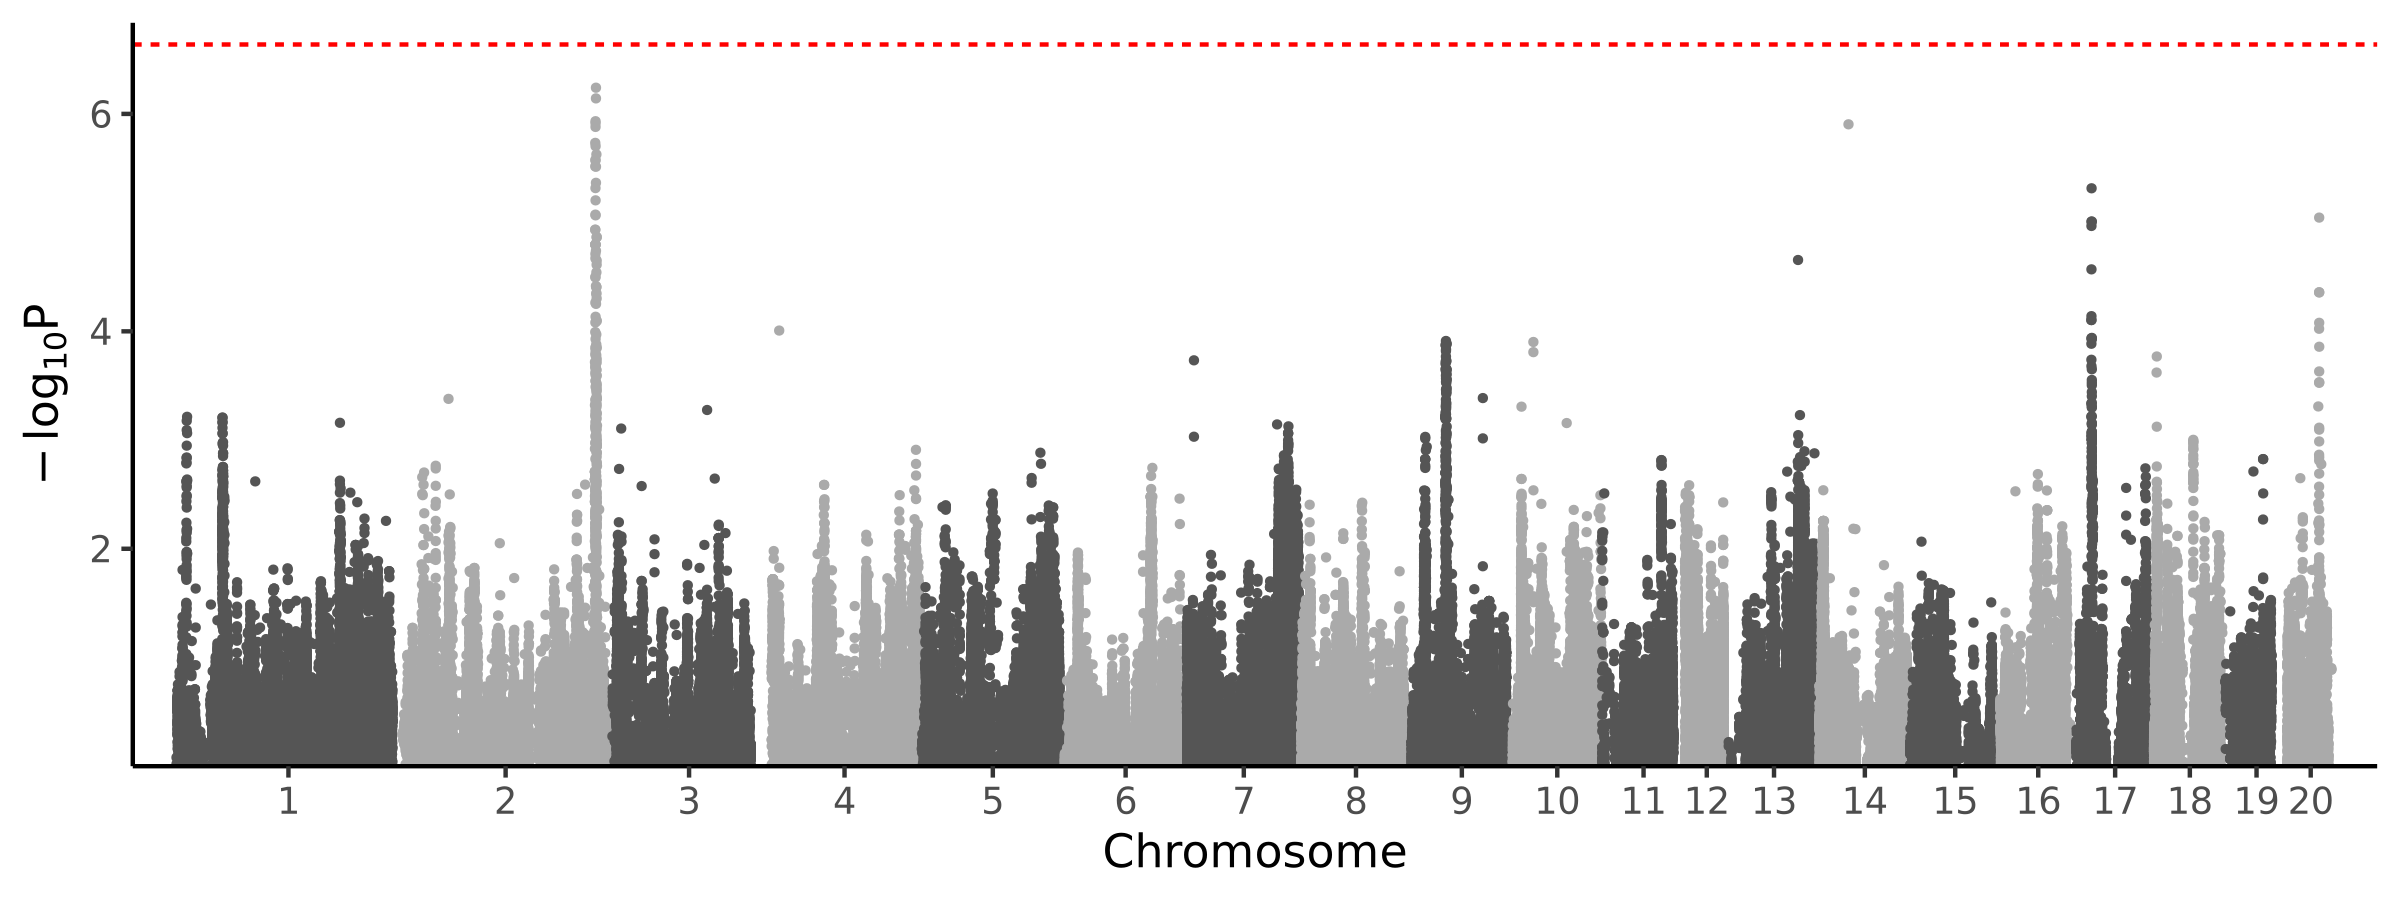
Hub : Traits

Post-drug Anxiety

Post-drug hide time

Tags: Behavior · Cocaine

Project: p50_paul_meyer_2020

1 significantly associated model · 1 unique gene

Significant Loci

# chr p0 p1 # assoc genes # joint models best TWAS P best SNP P cond SNP P % var exp joint genes
1 2 90636696 92031287 1 1 2.5e-09 0.027 1.8e-10 -734 Snx16

p0: physical position of the start of the locus. p1: physical position of the end of the locus. # joint models: number of models selected by step-wise conditional analysis.

Pleiotropic Associations

Trait chisq ratio # genes+ # genes++ % genes++ corr corr P genes
BMI with tail 2.9 1 0 0 0 1 Snx16
BMI without tail 22.6 1 1 100 0 1 Snx16
Body weight 5.0 1 0 0 0 1 Snx16
Epididymis fat weight 1.9 1 0 0 0 1 Snx16
Heart weight 3.1 1 0 0 0 1 Snx16
Tail length 14.4 1 1 100 0 1 Snx16
Length with tail 2.6 1 0 0 0 1 Snx16
Length without tail 2.8 1 0 0 0 1 Snx16
Liver weight, right 3.5 1 0 0 0 1 Snx16
Intraocular pressure 5.5 1 0 0 0 1 Snx16
Extensor digitorum longus weight 8.2 1 1 100 0 1 Snx16
Tibialis anterior weight 8.1 1 1 100 0 1 Snx16
Mean time between licks in bursts 3.0 1 0 0 0 1 Snx16
Indifference point AUC 16.6 1 0 0 0 1 Snx16
Indifference point function ln k 3.5 1 0 0 0 1 Snx16
Indifference point function log k 3.5 1 0 0 0 1 Snx16
Delay discounting total patch changes 12 sec 3.7 1 0 0 0 1 Snx16
Delay discounting total patch changes 18 sec 4.8 1 0 0 0 1 Snx16
Delay discounting total patch changes 6 sec 4.3 1 0 0 0 1 Snx16
Delay discounting time to switch 0 sec 11.4 1 0 0 0 1 Snx16
Delay discounting water rate 0 sec 3.6 1 0 0 0 1 Snx16
Delay discounting water rate 6 sec 3.1 1 0 0 0 1 Snx16
Locomotor activity 2.5 1 0 0 0 1 Snx16
Reaction time number correct 5.6 1 0 0 0 1 Snx16
Reaction time mean minus median 5.8 1 0 0 0 1 Snx16
Reaction time mean minus median AUC 6.1 1 0 0 0 1 Snx16
Reaction time num false alarms 7.7 1 0 0 0 1 Snx16
Reaction time trials correct on left 5.6 1 0 0 0 1 Snx16
Reaction time trials on left 5.3 1 0 0 0 1 Snx16
Reaction time omissions 7.3 1 0 0 0 1 Snx16
Std. dev. reaction times 7.6 1 0 0 0 1 Snx16
Reaction time trials completed 5.3 1 0 0 0 1 Snx16
Reaction time trials AUC 6.2 1 0 0 0 1 Snx16
Social responses 8.3 1 0 0 0 1 Snx16
Intermittent access intake day 1-15 change 14.5 1 0 0 0 1 Snx16
Intermittent access intake escalation 12.8 1 0 0 0 1 Snx16
Intermittent access intake escalation 2 28.1 1 1 100 0 1 Snx16
Intermittent access terminal intake (last 3 days) 6.3 1 0 0 0 1 Snx16
Intermittent access standard deviation 19.8 1 0 0 0 1 Snx16
Cocaine induced anxiety 14.0 1 0 0 0 1 Snx16
Progressive ratio test 1 active lever presses 8.0 1 0 0 0 1 Snx16
Progressive ratio test 1 breakpoint 4.3 1 0 0 0 1 Snx16
Progressive ratio test 1 inactive lever presses 3.9 1 0 0 0 1 Snx16
Short access day 10 total locomotion 3.8 1 0 0 0 1 Snx16
One hour access (shock baseline) 3.8 1 0 0 0 1 Snx16
Stereotopy head waving bouts, day 7 4.5 1 0 0 0 1 Snx16
Stereotopy head waving duration, day 7 4.2 1 0 0 0 1 Snx16
Degree of sensitization stereotypy 4.4 1 0 0 0 1 Snx16
Condit. Reinf. active-inactive response ratio 4.9 1 0 0 0 1 Snx16
Time in familiar zone, hab. session 1 12.3 1 0 0 0 1 Snx16
Time in novel zone, hab. session 1 6.2 1 0 0 0 1 Snx16
Time in familiar zone, hab. session 2 6.1 1 0 0 0 1 Snx16
Bone: elastic displacement 4.4 1 0 0 0 1 Snx16
Bone: elastic work 4.6 1 0 0 0 1 Snx16
Bone: endosteal estimation 3.8 1 0 0 0 1 Snx16
Bone: final force 3.6 1 0 0 0 1 Snx16
Bone: final moment 3.3 1 0 0 0 1 Snx16
Bone: marrow area 4.3 1 0 0 0 1 Snx16
Bone: maximum force 2.9 1 0 0 0 1 Snx16
Bone: maximum moment 2.6 1 0 0 0 1 Snx16
Bone: minimum diameter 7.6 1 0 0 0 1 Snx16
Bone: periosteal estimation 4.4 1 0 0 0 1 Snx16
Bone: trabecular number 2.8 1 0 0 0 1 Snx16
Distance traveled before self-admin 17.0 1 0 0 0 1 Snx16
Distance traveled after self-admin 7.3 1 0 0 0 1 Snx16
Delta time in closed arm before/after self-admin 8.6 1 0 0 0 1 Snx16
Diff in mean of infusions in LGA sessions 9.8 1 0 0 0 1 Snx16
Active lever presses in extinction session 6 8.4 1 0 0 0 1 Snx16
Time in closed arm after self-admin 4.0 1 0 0 0 1 Snx16
Time in open arm before self-admin 5.6 1 0 0 0 1 Snx16
Time to tail flick, vehicle, before self-admin 9.9 1 0 0 0 1 Snx16
Time to tail flick, test, before self-admin 20.6 1 0 0 0 1 Snx16
Ambulatory time after self-admin 5.2 1 0 0 0 1 Snx16
Delay disc. indifference point, 8s delay 8.9 1 0 0 0 1 Snx16
Fecal boli incidents, locomotor time 1 7.5 1 0 0 0 1 Snx16
Time >=10cm from walls, locomotor time 1 13.9 1 0 0 0 1 Snx16
Bouts of movement, locomotor time 1 10.5 1 0 0 0 1 Snx16
Total resting periods, locomotor time 1 4.6 1 0 0 0 1 Snx16
Total resting periods, locomotor time 2 4.8 1 0 0 0 1 Snx16
Rest time, locomotor task time 2 5.2 1 0 0 0 1 Snx16
Weight adjusted by age 50.3 1 1 100 0 1 Snx16
Seeking ratio, delayed vs. immediate footshock 22.6 1 1 100 0 1 Snx16
Locomotion in novel chamber post-restriction 3.5 1 0 0 0 1 Snx16
Food seeking constrained by brief footshock 16.7 1 0 0 0 1 Snx16
Latency to leave start box in cocaine runway, F 4.2 1 0 0 0 1 Snx16
Na content in liver 3.7 1 0 0 0 1 Snx16

chisq ratio: Average Chi2 statistic for the selected genes in the secondary trait, divided by the average statistic for all genes in the secondary trait. # genes+: Shared significant genes at Bonferroni correction. # genes++: Shared significant genes at transcriptome-wide significance. % genes++: Number of [++] genes as a percentage of primary trait’s total joint genes. corr: Correlation of effect sizes across the [+] genes.

Associations by panel

tissue modality # hits % hits/tests avg chisq
Adipose alternative polyA 0 0.000 1.05
Adipose alternative TSS 0 0.000 1.23
Adipose gene expression 1 0.012 1.13
Adipose isoform ratio 0 0.000 1.11
Adipose intron excision ratio 0 0.000 1.11
Adipose mRNA stability 0 0.000 1.05
BLA alternative polyA 0 0.000 1.06
BLA alternative TSS 0 0.000 1.10
BLA gene expression 0 0.000 1.10
BLA isoform ratio 0 0.000 1.17
BLA intron excision ratio 0 0.000 1.13
BLA mRNA stability 0 0.000 1.14
Brain alternative polyA 0 0.000 1.13
Brain alternative TSS 0 0.000 1.14
Brain gene expression 0 0.000 1.09
Brain isoform ratio 0 0.000 1.13
Brain intron excision ratio 0 0.000 1.12
Brain mRNA stability 0 0.000 1.09
Eye alternative polyA 0 0.000 1.56
Eye alternative TSS 0 0.000 1.20
Eye gene expression 0 0.000 1.14
Eye isoform ratio 0 0.000 1.15
Eye intron excision ratio 0 0.000 1.11
Eye mRNA stability 0 0.000 1.16
IL alternative polyA 0 0.000 1.16
IL alternative TSS 0 0.000 1.28
IL gene expression 0 0.000 1.07
IL isoform ratio 0 0.000 1.18
IL intron excision ratio 0 0.000 1.03
IL mRNA stability 0 0.000 1.06
LHb alternative polyA 0 0.000 1.11
LHb alternative TSS 0 0.000 0.96
LHb gene expression 0 0.000 1.10
LHb isoform ratio 0 0.000 1.10
LHb intron excision ratio 0 0.000 1.09
LHb mRNA stability 0 0.000 1.03
Liver alternative polyA 0 0.000 1.12
Liver alternative TSS 0 0.000 1.11
Liver gene expression 0 0.000 1.11
Liver isoform ratio 0 0.000 1.14
Liver intron excision ratio 0 0.000 1.09
Liver mRNA stability 0 0.000 1.10
NAcc alternative polyA 0 0.000 1.10
NAcc alternative TSS 0 0.000 1.15
NAcc gene expression 0 0.000 1.07
NAcc isoform ratio 0 0.000 1.20
NAcc intron excision ratio 0 0.000 1.15
NAcc mRNA stability 0 0.000 1.10
OFC alternative polyA 0 0.000 1.08
OFC alternative TSS 0 0.000 1.15
OFC gene expression 0 0.000 1.07
OFC isoform ratio 0 0.000 1.12
OFC intron excision ratio 0 0.000 1.06
OFC mRNA stability 0 0.000 1.08
PL alternative polyA 0 0.000 1.10
PL alternative TSS 0 0.000 1.19
PL gene expression 0 0.000 1.10
PL isoform ratio 0 0.000 1.16
PL intron excision ratio 0 0.000 1.12
PL mRNA stability 0 0.000 1.10

avg chisq: Average Chi2 (squared Z-score) across all models in this panel for this trait.