Sr content in liver
Tags: Physiology · Liver
Project: vulpe_liver_2014
2 loci · 2 genes with independent associations · 6 total associated genes
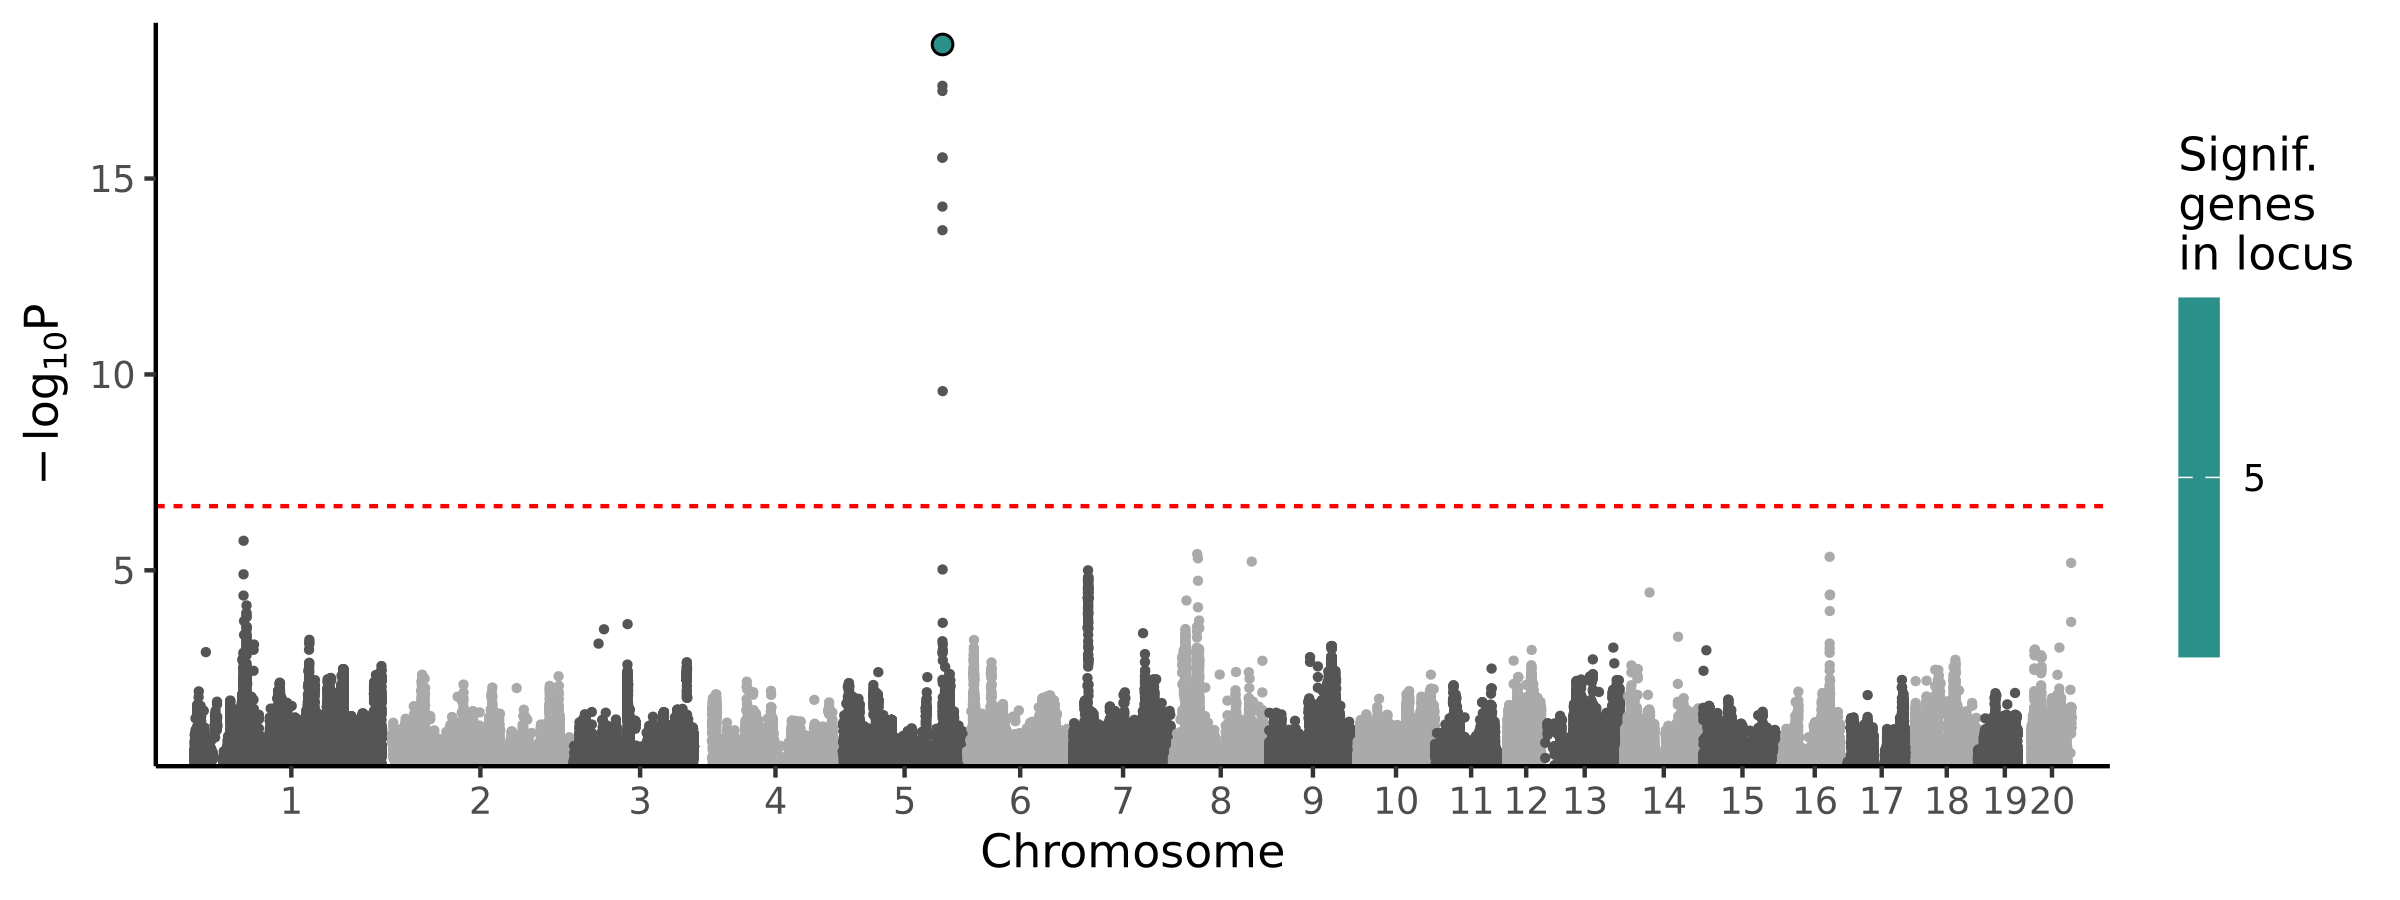
Significant Loci
| # | Chr | Start pos | End pos | # assoc genes | # joint models | Best TWAS P | Best GWAS P | Cond GWAS P | Joint genes |
|---|---|---|---|---|---|---|---|---|---|
| 1 | chr5 | 142950162 | 144036879 | 5 | 1 | 2.71e-22 | 2.66e-01 | 8.93e-15 | Stk40 |
| 2 | chr16 | 72470120 | 73870022 | 1 | 1 | 7.95e-08 | 2.56e-04 | 8.70e-01 | Nsd3 |
Pleiotropic Associations
Associations by panel
| Tissue | RNA modality | # hits | % hits/tests | Avg chisq |
|---|---|---|---|---|
| Adipose | alternative polyA | 0 | 0 | 0.92 |
| Adipose | alternative TSS | 0 | 0 | 0.91 |
| Adipose | gene expression | 0 | 0 | 0.89 |
| Adipose | isoform ratio | 2 | 0 | 0.9 |
| Adipose | intron excision ratio | 0 | 0 | 0.87 |
| Adipose | mRNA stability | 0 | 0 | 0.88 |
| BLA | alternative polyA | 0 | 0 | 0.89 |
| BLA | alternative TSS | 0 | 0 | 0.85 |
| BLA | gene expression | 0 | 0 | 0.88 |
| BLA | isoform ratio | 0 | 0 | 0.86 |
| BLA | intron excision ratio | 0 | 0 | 0.85 |
| BLA | mRNA stability | 0 | 0 | 0.88 |
| Brain | alternative polyA | 0 | 0 | 0.89 |
| Brain | alternative TSS | 0 | 0 | 0.93 |
| Brain | gene expression | 0 | 0 | 0.87 |
| Brain | isoform ratio | 0 | 0 | 0.87 |
| Brain | intron excision ratio | 0 | 0 | 0.86 |
| Brain | mRNA stability | 0 | 0 | 0.9 |
| Eye | alternative polyA | 0 | 0 | 1.03 |
| Eye | alternative TSS | 0 | 0 | 0.84 |
| Eye | gene expression | 0 | 0 | 0.94 |
| Eye | isoform ratio | 0 | 0 | 0.94 |
| Eye | intron excision ratio | 0 | 0 | 0.79 |
| Eye | mRNA stability | 0 | 0 | 0.82 |
| IC | alternative polyA | 0 | 0 | 0.91 |
| IC | alternative TSS | 0 | 0 | 0.87 |
| IC | gene expression | 0 | 0 | 0.86 |
| IC | isoform ratio | 0 | 0 | 0.87 |
| IC | intron excision ratio | 0 | 0 | 0.85 |
| IC | mRNA stability | 0 | 0 | 0.84 |
| IL | alternative polyA | 0 | 0 | 0.82 |
| IL | alternative TSS | 0 | 0 | 0.9 |
| IL | gene expression | 0 | 0 | 0.92 |
| IL | isoform ratio | 0 | 0 | 0.89 |
| IL | intron excision ratio | 0 | 0 | 0.79 |
| IL | mRNA stability | 0 | 0 | 0.9 |
| LHb | alternative polyA | 0 | 0 | 0.87 |
| LHb | alternative TSS | 0 | 0 | 0.96 |
| LHb | gene expression | 0 | 0 | 0.88 |
| LHb | isoform ratio | 0 | 0 | 0.87 |
| LHb | intron excision ratio | 0 | 0 | 0.83 |
| LHb | mRNA stability | 0 | 0 | 0.88 |
| Liver | alternative polyA | 2 | 0.1 | 0.94 |
| Liver | alternative TSS | 0 | 0 | 0.86 |
| Liver | gene expression | 1 | 0 | 0.91 |
| Liver | isoform ratio | 2 | 0.1 | 0.92 |
| Liver | intron excision ratio | 0 | 0 | 0.87 |
| Liver | mRNA stability | 0 | 0 | 0.89 |
| NAcc | alternative polyA | 0 | 0 | 0.92 |
| NAcc | alternative TSS | 0 | 0 | 0.85 |
| NAcc | gene expression | 0 | 0 | 0.89 |
| NAcc | isoform ratio | 0 | 0 | 0.84 |
| NAcc | intron excision ratio | 0 | 0 | 0.84 |
| NAcc | mRNA stability | 0 | 0 | 0.87 |
| OFC | alternative polyA | 0 | 0 | 0.86 |
| OFC | alternative TSS | 0 | 0 | 0.83 |
| OFC | gene expression | 0 | 0 | 0.88 |
| OFC | isoform ratio | 0 | 0 | 0.92 |
| OFC | intron excision ratio | 0 | 0 | 0.76 |
| OFC | mRNA stability | 0 | 0 | 0.86 |
| PL | alternative polyA | 0 | 0 | 0.95 |
| PL | alternative TSS | 0 | 0 | 0.87 |
| PL | gene expression | 0 | 0 | 0.89 |
| PL | isoform ratio | 0 | 0 | 0.86 |
| PL | intron excision ratio | 0 | 0 | 0.82 |
| PL | mRNA stability | 1 | 0 | 0.86 |
| pVTA | alternative polyA | 0 | 0 | 0.89 |
| pVTA | alternative TSS | 0 | 0 | 0.83 |
| pVTA | gene expression | 0 | 0 | 0.89 |
| pVTA | isoform ratio | 0 | 0 | 0.82 |
| pVTA | intron excision ratio | 0 | 0 | 0.85 |
| pVTA | mRNA stability | 0 | 0 | 0.84 |
| RMTg | alternative polyA | 0 | 0 | 0.78 |
| RMTg | alternative TSS | 0 | 0 | 0.85 |
| RMTg | gene expression | 0 | 0 | 0.86 |
| RMTg | isoform ratio | 0 | 0 | 0.98 |
| RMTg | intron excision ratio | 0 | 0 | 0.8 |
| RMTg | mRNA stability | 0 | 0 | 0.91 |