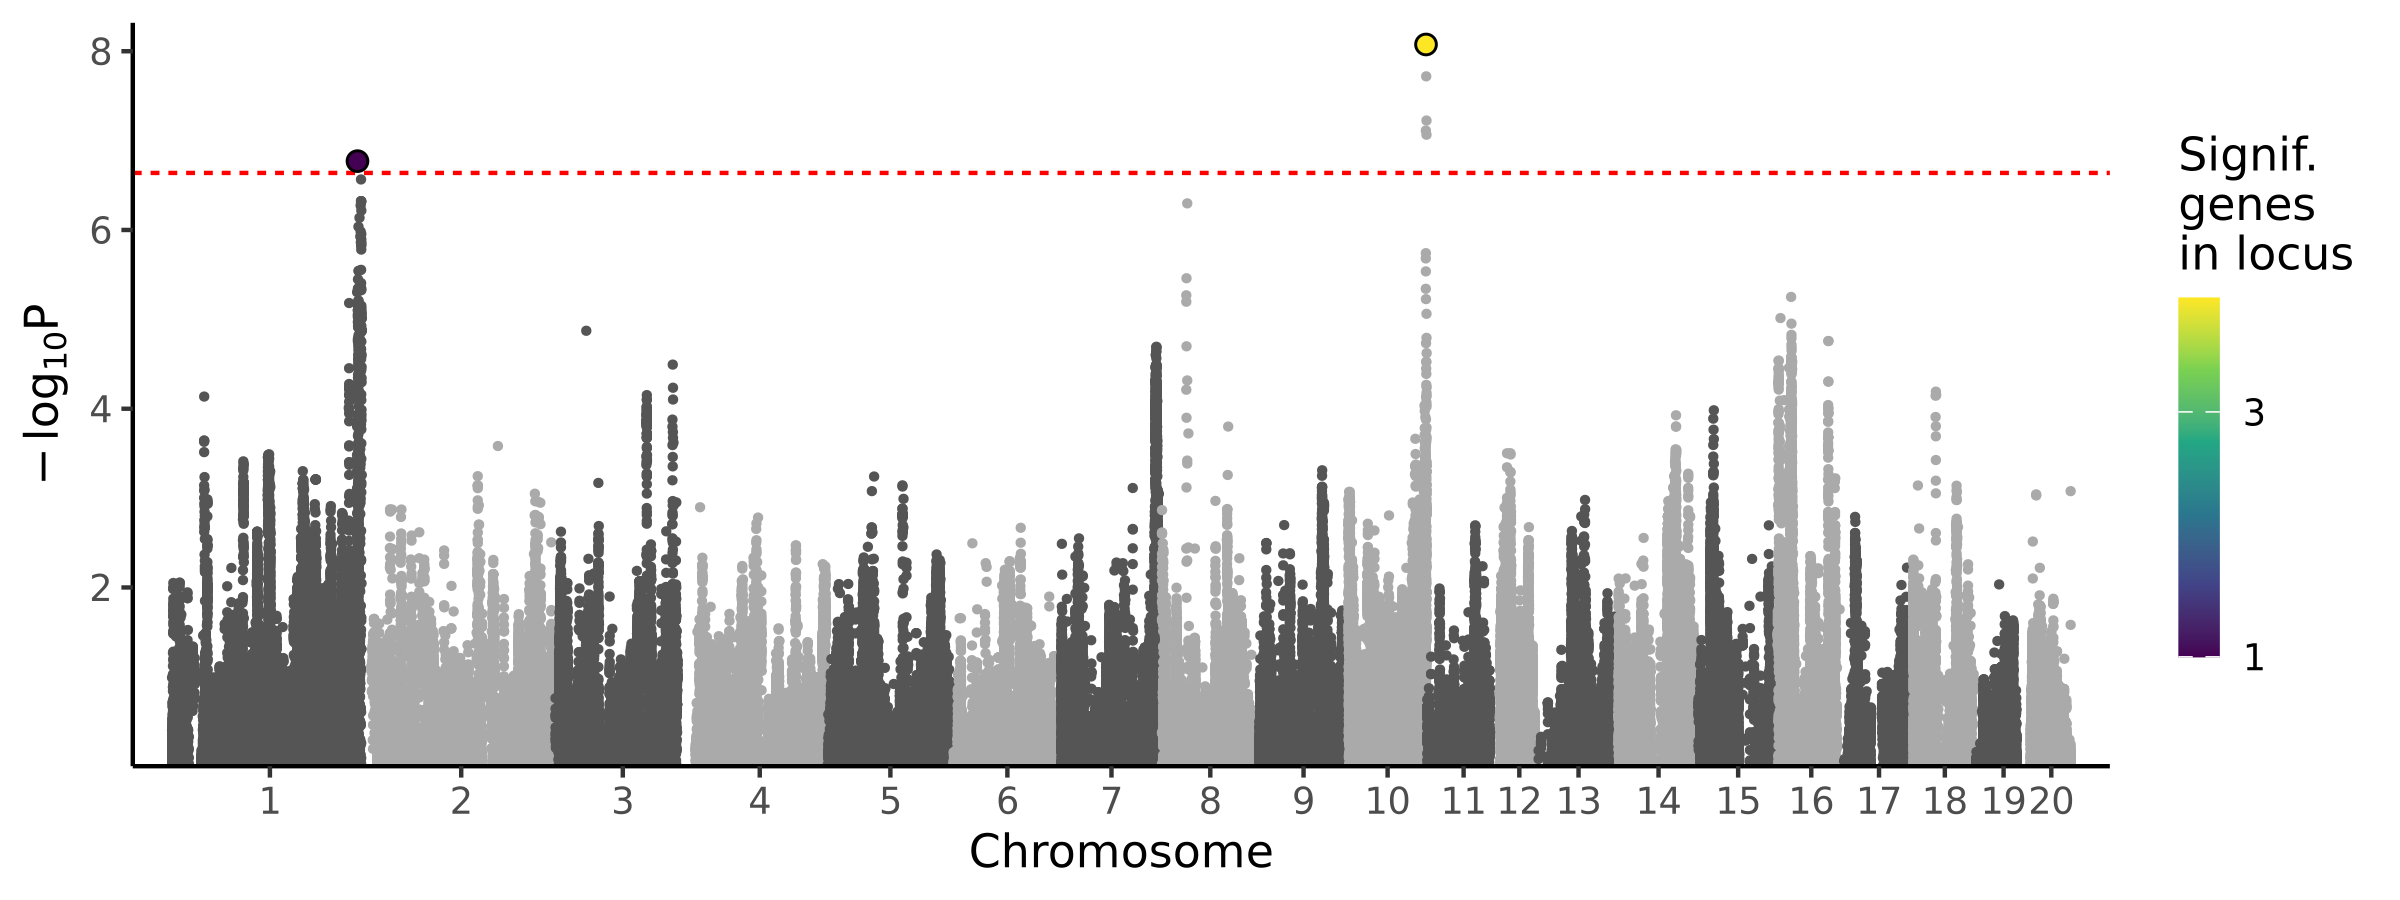
Bone: cortical area
Tags: Physiology · Bone
Project: r01_doug_adams
2 loci · 5 genes with independent associations · 6 total associated genes

Significant Loci
| # | Chr | Start pos | End pos | # assoc genes | # joint models | Best TWAS P | Best GWAS P | Cond GWAS P | Joint genes |
|---|---|---|---|---|---|---|---|---|---|
| 1 | chr1 | 254086596 | 255485810 | 1 | 1 | 1.7e-07 | 2.40e-06 | 1.35e-04 | Tcf7l2 |
| 2 | chr10 | 105364159 | 107195627 | 5 | 4 | 8.4e-09 | 1.54e-09 | 1.16e-03 | B3gntl1 Dus1l Foxk2 |
Pleiotropic Associations
Associations by panel
| Tissue | RNA modality | # hits | % hits/tests | Avg chisq |
|---|---|---|---|---|
| Adipose | alternative polyA | 2 | 0.1 | 1.63 |
| Adipose | alternative TSS | 1 | 0 | 1.56 |
| Adipose | gene expression | 0 | 0 | 1.51 |
| Adipose | isoform ratio | 0 | 0 | 1.53 |
| Adipose | intron excision ratio | 0 | 0 | 1.45 |
| Adipose | mRNA stability | 0 | 0 | 1.53 |
| BLA | alternative polyA | 0 | 0 | 1.55 |
| BLA | alternative TSS | 0 | 0 | 1.55 |
| BLA | gene expression | 0 | 0 | 1.55 |
| BLA | isoform ratio | 0 | 0 | 1.44 |
| BLA | intron excision ratio | 0 | 0 | 1.43 |
| BLA | mRNA stability | 0 | 0 | 1.52 |
| Brain | alternative polyA | 0 | 0 | 1.56 |
| Brain | alternative TSS | 0 | 0 | 1.47 |
| Brain | gene expression | 0 | 0 | 1.51 |
| Brain | isoform ratio | 0 | 0 | 1.54 |
| Brain | intron excision ratio | 0 | 0 | 1.45 |
| Brain | mRNA stability | 0 | 0 | 1.52 |
| Eye | alternative polyA | 0 | 0 | 1.61 |
| Eye | alternative TSS | 0 | 0 | 1.04 |
| Eye | gene expression | 0 | 0 | 1.49 |
| Eye | isoform ratio | 0 | 0 | 1.66 |
| Eye | intron excision ratio | 0 | 0 | 1.33 |
| Eye | mRNA stability | 0 | 0 | 1.36 |
| IL | alternative polyA | 0 | 0 | 1.44 |
| IL | alternative TSS | 0 | 0 | 1.53 |
| IL | gene expression | 0 | 0 | 1.58 |
| IL | isoform ratio | 0 | 0 | 1.45 |
| IL | intron excision ratio | 0 | 0 | 1.44 |
| IL | mRNA stability | 0 | 0 | 1.63 |
| LHb | alternative polyA | 0 | 0 | 1.49 |
| LHb | alternative TSS | 1 | 0.2 | 1.29 |
| LHb | gene expression | 0 | 0 | 1.54 |
| LHb | isoform ratio | 0 | 0 | 1.41 |
| LHb | intron excision ratio | 0 | 0 | 1.35 |
| LHb | mRNA stability | 0 | 0 | 1.53 |
| Liver | alternative polyA | 0 | 0 | 1.52 |
| Liver | alternative TSS | 0 | 0 | 1.39 |
| Liver | gene expression | 0 | 0 | 1.52 |
| Liver | isoform ratio | 0 | 0 | 1.52 |
| Liver | intron excision ratio | 1 | 0 | 1.44 |
| Liver | mRNA stability | 0 | 0 | 1.5 |
| NAcc | alternative polyA | 0 | 0 | 1.48 |
| NAcc | alternative TSS | 0 | 0 | 1.55 |
| NAcc | gene expression | 0 | 0 | 1.53 |
| NAcc | isoform ratio | 0 | 0 | 1.53 |
| NAcc | intron excision ratio | 0 | 0 | 1.46 |
| NAcc | mRNA stability | 0 | 0 | 1.54 |
| OFC | alternative polyA | 0 | 0 | 1.53 |
| OFC | alternative TSS | 0 | 0 | 1.49 |
| OFC | gene expression | 0 | 0 | 1.56 |
| OFC | isoform ratio | 0 | 0 | 1.4 |
| OFC | intron excision ratio | 0 | 0 | 1.44 |
| OFC | mRNA stability | 0 | 0 | 1.58 |
| PL | alternative polyA | 0 | 0 | 1.53 |
| PL | alternative TSS | 0 | 0 | 1.51 |
| PL | gene expression | 0 | 0 | 1.57 |
| PL | isoform ratio | 0 | 0 | 1.56 |
| PL | intron excision ratio | 0 | 0 | 1.45 |
| PL | mRNA stability | 0 | 0 | 1.53 |
| pVTA | alternative polyA | 0 | 0 | 1.58 |
| pVTA | alternative TSS | 0 | 0 | 1.35 |
| pVTA | gene expression | 0 | 0 | 1.55 |
| pVTA | isoform ratio | 1 | 0 | 1.51 |
| pVTA | intron excision ratio | 0 | 0 | 1.46 |
| pVTA | mRNA stability | 0 | 0 | 1.56 |
| RMTg | alternative polyA | 0 | 0 | 1.37 |
| RMTg | alternative TSS | 0 | 0 | 1.63 |
| RMTg | gene expression | 0 | 0 | 1.48 |
| RMTg | isoform ratio | 0 | 0 | 1.46 |
| RMTg | intron excision ratio | 0 | 0 | 1.26 |
| RMTg | mRNA stability | 0 | 0 | 1.59 |